Part 8. AWS at a glance - CloudWatch, CloudTrail
Through monitoring, you can prevent issues, check performance and costs, and receive data to internally consider scaling plans.
AWS CloudWatch
A service that manages monitoring, log collection, metric analysis, alert settings, and automated responses for all AWS cloud resources and applications. Used as a role to collect metrics or manage logs. In addition, automated tasks are performed by linking ASG, Lambda, and Function using CloudWatch. By default, information about EC2 memory usage is not provided, so separate settings are required.
PutMetricData
Custom Metrics
Metric refers to a metric for a specific resource. For example, in 'EC2 instance CPU share', it refers to a value such as CPU share.
- CPU, Disk Metrics, RAM, Netstat, Processes, Swap Space
- High-Resolution Custom Metrics: 1-second granular data
- Alarm settings for High-Resolution Custom Metrics: Alarm can be set in 10-second or 30-second increments or in multiples of 60 seconds
In addition to the metrics provided by default in AWS CloudWatch, users can create and define specific metrics. When creating a Custom Metric, you can use
dimensionsto make the metric settings more clear. You can group instances by name and value as dimensions.
aws cloudwatch put-metric-data --metric-name Buffers --namespace MyNameSpace --unit Bytes --value 231434333 --dimensions InstanceId=1-23456789,InstanceType=m1.small
AWS CloudWatch Log
Log Insights
It is not real-time data, it is a query-based engine.
Logs are encrypted by default and keys can be KMS-based. Log data can be saved to S3 after 12 hours and can be done with the CreateExportTask setting.
fields @timestamp, @message
| filter requestParameters.instancesSet.items.0.instanceId="i-abcde123"
| sort @timestamp desc
CloudWatch Log Subscriptions
If you want to check real-time logs, you can use CloudWatch Log Subscriptions. This log data can also be sent to Kinesis or Lambda through Subscription Filter.
- You can receive corresponding logs in real time using
LiveTail, and you can use it for free for 1 hour every day.
CloudWatch Alarms
By default, it provides alarms for one metric, but with Composite Alarm, you can receive alarms for multiple metrics. Provides AND and OR conditions. In this way, you can prevent unnecessary alarms by receiving only accurate alarms through alarms for various indicators.
- Use
set-alarm-stateto test global traffic increase.
CloudWatch Synthetics Canary
Monitoring is possible using Canary, a script that runs on a schedule. You can check for potentially problematic endpoint delays, save load time data or UI screenshots. Together with AWS X-Ray, it provides a holistic view of the service and is used to identify performance bottlenecks.
AWS EventBridge
This service was previously called CloudWatch Event. EventBridge provides a near real-time stream of system events that describe changes to AWS resources. It operates through scheduling using a cron job, method according to event pattern, or occurrence according to trigger. You can also set EventBus only in the main account and collect events that occur in other accounts and apply them to EventBus.
- Default Event Bus reacts according to AWS resources
- Partner Event Bus that reacts according to AWS SaaS partners (zendesk, DATADOG, etc.)
- Custom Event Bus that reacts according to Custom App We have a new feature called Sandbox that allows you to define event patterns and use sample events to check if they match the events you want, without having to create or edit new rules.
CloudWatch Evidently
When you change or introduce new features in your application, it monitors user reactions in real time and helps you make data-driven decisions. Feature Flags to enable/disable features and A/B testing experiments are possible.
AWS X-Ray
It is a service that allows you to analyze and debug application performance. It traces the request flow of an application through distributed tracing and provides a service map that expresses interactions between services. By requesting a detailed transaction flow, you can determine how much each service took and where errors occurred.
- APIs
- AWS X-Ray deamon can be set when creating Elastic Beanstalk.
- The
.ebextensions/xray-daemon.configconfiguration file is required. - AWS X-Ray deamon configuration options in ECS Cluster
- Set up one deamon on each EC2
- Run one deamon in the form of a side-car for each application.
- In Fargate Cluster, each application container runs one deamon in the form of a sidecar.
- Use annotation to add additional information to the trace.
How X-Ray works
X-Ray works by having the AWS X-Ray SDK in your application code, running traces in the X-Ray Daemon and regularly delivering them in batches to AWS X-Ray Daemon operates on low-level UDP packets.
X-Ray Instrumentation
Instrumentation means measuring product performance and diagnosing errors. For application instrumentation, there are two ways: using OpenTelementry and using X-Ray SDK. You can use it simply by adding dependencies using the SDK.
dependencies {
compile("com.amazonaws:aws-xray-recorder-sdk-core")
compile("com.amazonaws:aws-xray-recorder-sdk-aws-sdk")
compile("com.amazonaws:aws-xray-recorder-sdk-aws-sdk-instrumentor")
compile("com.amazonaws:aws-xray-recorder-sdk-apache-http")
compile("com.amazonaws:aws-xray-recorder-sdk-sql-postgres")
compile("com.amazonaws:aws-xray-recorder-sdk-sql-mysql")
testCompile("junit:junit:4.11")
}
dependencyManagement {
imports {
mavenBom('com.amazonaws:aws-xray-recorder-sdk-bom:2.11.0')
}
}
X-Ray Sampling Rule
According to Sampling rule, at least one request per second must be recorded. By default, the
{
"version": 2,
"rules": [
{
"description": "Player moves.",
"host": "*",
"http_method": "*",
"url_path": "/api/move/*",
"fixed_target": 0,
"rate": 0.05
}
],
"default": {
"fixed_target": 1,
"rate": 0.1
}
}
Because recording too many requests can be costly, it is important to set an X-Ray Sampling Rule so that necessary requests can be recorded. You can create an X-Ray Sampling Rule arbitrarily.
AWS Distro for OpenTelementry
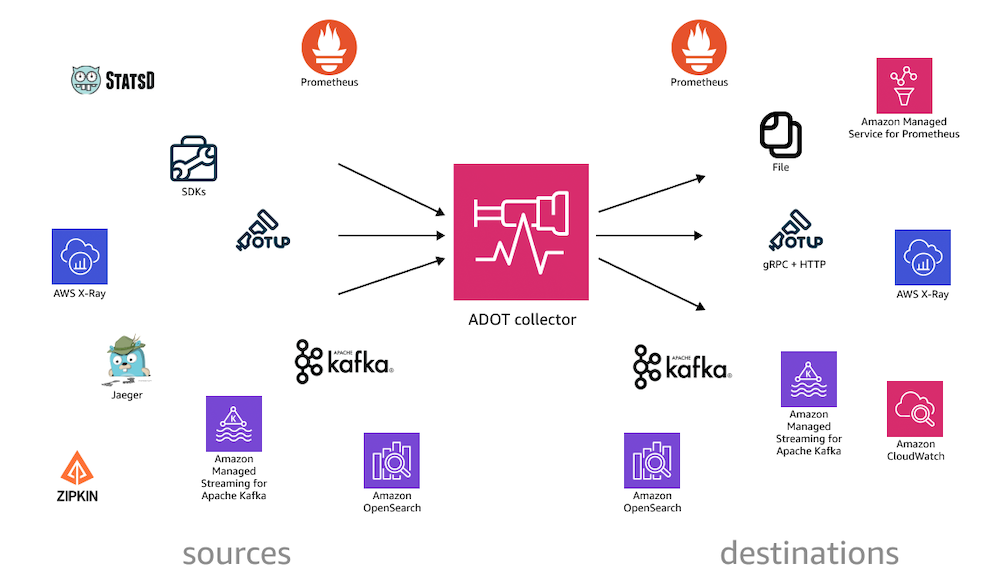
It is a monitoring tool to obtain distributed traces and metrics of applications. Of course, you can also collect metadata from AWS resources and services. It is similar to X-ray, but trace and metric information can be provided to AWS services or partner solutions without modifying code.
AWS CloudTrail
A service that records and stores all API calls that occur in your AWS account. These logs help you track who changed what AWS resources and when, providing valuable data for security, auditing, compliance, and troubleshooting. You can send these logs to CloudWatch or S3. -Event options
- Management events are matters such as policy settings or security settings.
- Data Event is not basic because its volume is basically large.
- CloudTrail Insight Event is an event recorded when something unusual is detected.
- By default, events are stored for 90 days and then deleted. If you want to store data for a longer period of time, you can set long-term retention using S3.
- Using EventBridge, when an event called a specific API occurs, an alert can be sent using SNS with an appropriate rule.
- CloudTrail is different in that it leaves API call audit logs, CloudWatch does monitoring, and X-ray is a service that provides detailed trace-based analysis.
Comments
No comments yet. Be the first!
164 posts in 테크
- 2233D Gaussian Splatting vs Unreal Engine: Two Ways to Build a 3D World — and Where Each One Ships
- 222LLMs Inside Unreal Engine: The New Skills Game Developers Need in 2026
- 220Living With Claude Fable 5: How the Most Capable Model Changes the Way You Actually Work
- 219Luma's Bet: From Video Generator to a Single Model That Thinks in Pixels
- 215The Best AI Video Models in 2026: Types, Differences, and Where This Is All Going